Why I Am the Antiplanner

In 1997, Metro — Portland’s regional planning agency — issued its 2040 plan to guide the region for the next several decades. The plan was supposed to be in response to a 1995 Future Vision statement written by a group of citizens. Now Metro revising the Future Vision and its plans, but a close look at the region reveals that it should completely scrap the planning process.

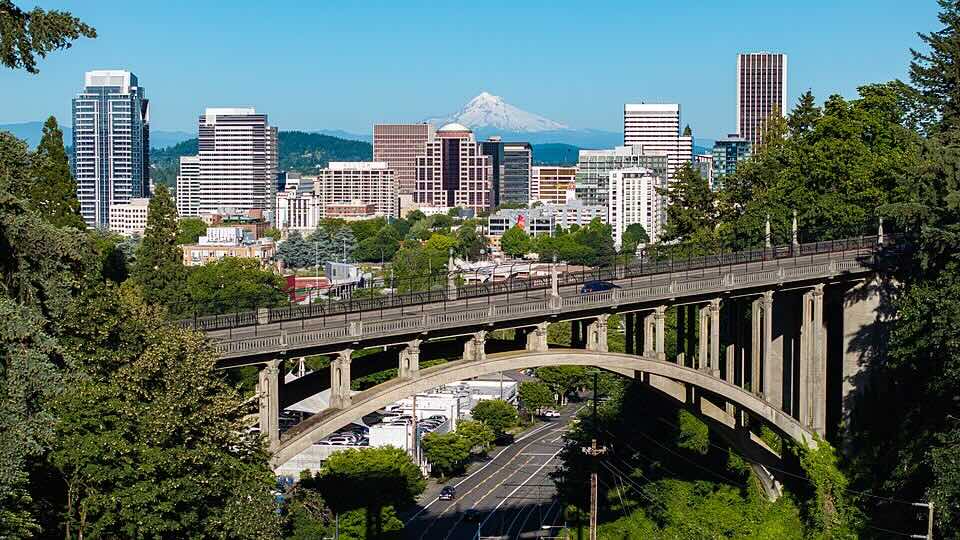
Downtown Portland and Mount Hood with the Vista Avenue Bridge — often called the Suicide Bridge — in the foreground. Portland’s quality of life has declined so much in the last 30 years that it is almost as if the city is trying to commit suicide. Photo by Spicypepper999.

The 1995 Future Vision called for “housing affordable for all,” “accessible employment centers throughout the region,” “equitable economic progress,” “public safety,” and reductions in poverty. By all of these measures, the region is worse today than it was in 1997, and this decline is almost entirely due to Metro’s 2040 plan. Continue reading

March 2025 Transport Results

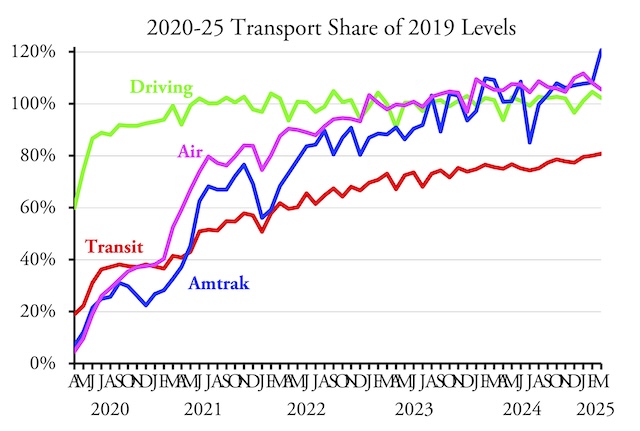
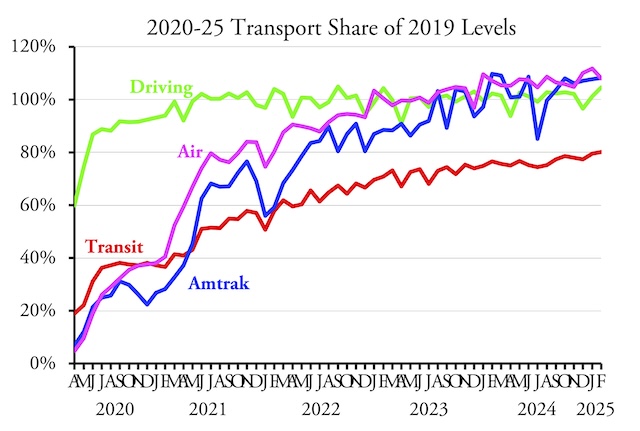
Amtrak boomed, carrying 21 percent more passenger-miles in March 2025 than the same month before the pandemic. The airlines carried 5.5 percent more passengers and highways carried 2.2 percent more vehicle-miles. As expected, transit continues to lag behind, carrying only 80.9 percent as many passengers as in March of 2019. That’s still the most since the beginning of the pandemic, but it is only 0.73 percent more (relative to 2019) than in February.

Amtrak data are from March monthly performance report; airline riders from Transportation Security Administration; highway vehicle-miles from the Federal Highway Administration, and transit data are from the Federal Transit Administration.

The transit industry is increasingly desperate to get more subsidies to offset the decline in ridership and the increase in operating expenses since 2019. Flush with Congressional COVID-relief funds, agencies increased salaries and wages and continued to operate nearly as many vehicle-miles of service despite the declines in ridership. Now the relief funds are running out and agencies that previously relied heavily on fares to fund their operations are getting panicky. Continue reading

Do Blacks Deserve Money Wasted on Them Too?

Critics of plans to build more light-rail lines in Charlotte, North Carolina say that proposed new lines will fail to serve the neighborhoods of blacks who “need it most.” Blacks are more likely than whites to ride transit, they say, so black neighborhoods need to have light rail too.

They are wrong about black’s use of transit. According to the 2023 American Community Survey, 1.5 percent of both black and white workers who lived in Charlotte took transit to work. In 2019, blacks had been more likely to ride transit — 4.5 percent vs. 2.5 percent — but since then the rise of remote working has allowed most former black Charlotte transit riders to work at home. Continue reading

A Modest Plan for Northern Virginia

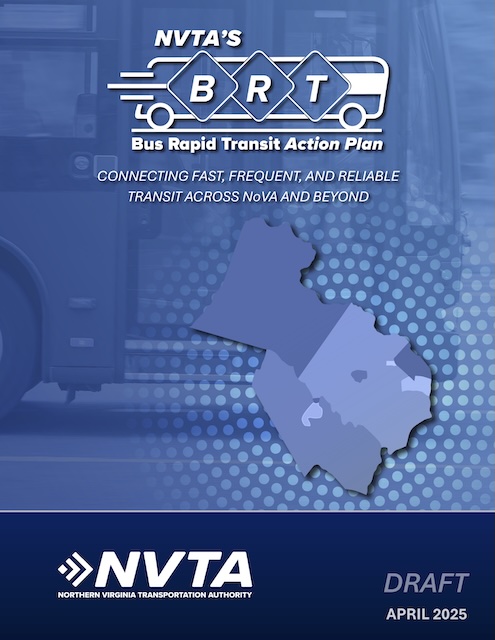
The Northern Virginia Transportation Authority (NVTA) wants to build 28 bus-rapid transit lines in the four counties (Fairfax, Loudoun, Arlington, and Prince William) and five cities (Alexandria, Fairfax, Falls Church, Manassas, and Manassas Park) in its jurisdiction. As described in the agency’s Bus Rapid Transit Action Plan, these lines total to 170 miles of bus routes.

Click image to download a 20-MB PDF of this 32-page plan.

I used to think bus-rapid transit was a smart and economical alternative to light rail, but the NVTA expects to spend $4.2 billion on this plan. The actual cost will almost certainly be more: one line that is already underway, the Richmond Highway route, was supposed to cost $638 million, but according to the Federal Transit Administration it is costing $730 million. That route is 7.4 miles long, which means the line is costing almost $100 million per mile. Continue reading

The Worst Transit Projects

YouTuber Alan Fisher, who makes videos about “city planning, transit and the rail industry,” asks the reasonable question, “what is the worst new transit project in the United States?” Without surveying all of the possible candidates (which he avoids by saying that interagency comparisons are not always possible), he asserts that the worst project is BART to San Jose.

As it happens, I made a similar suggestion a year ago. But a survey of the various projects now under construction suggests that Honolulu’s rail project is worse, at least from the point of view of local taxpayers. Continue reading

More Transit Skepticism

Transit’s fiscal cliff is the responsibility of transit agencies, advises the Chicago Tribune, and transit riders, taxpayers, and legislators should not be panicked into giving the agencies huge amounts of money to make up for this supposed crisis. Noting that Metra (Chicago’s commuter-rail agency) is paying its lobbyist more than $4.6 million to get more funding from the state, the Tribune suggests that money would have been better spent operating trains.

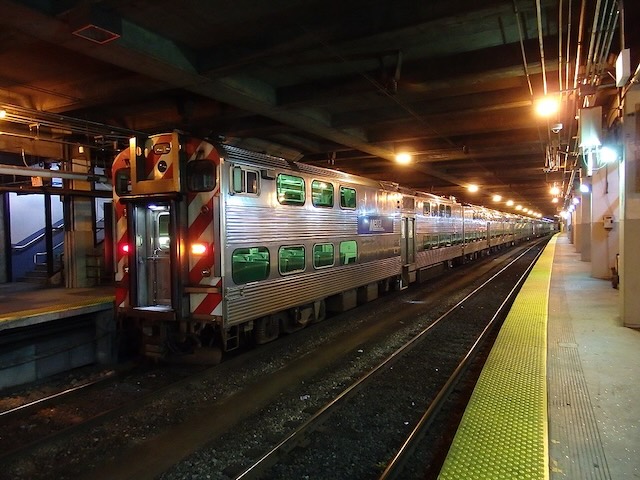
The fiscal picture for Chicago transit service is dim, but whose fault is that? Photo by ????.

The Tribune refers readers to a McKinsey report released last December that points out that many transit agencies are wildly inefficient. Some agencies spend three times as much, per vehicle revenue hour, operating buses as others. McKinsey also found “little correlation” between the amount of money agencies spent on capital improvements and their performance. Continue reading

Your Taxes Pay for Transit Agency Joy Rides

An investigation by WREG news has revealed that executives of the Memphis Area Transit Authority spend well over $100,000 a year on plane fares and hotel charges to attend various transit conferences in such cities as Atlanta, Chicago, Dallas, Detroit, Las Vegas, Phoenix, Orlando, Portland, San Francisco, Seattle, and Washington. As many as 10 MATA staff members attend some of these conferences. In one case, MATA’s CEO spent more than $11,400 on just one round-trip flight to Aukland, New Zealand, no doubt flying first class.

Reporters documented that MATA had spent more than $276,000 on travel and nearly $440,000 on hotels in the eight years between 2017 and 2024. Since travel would have been restricted by the pandemic for at least one of those years, the annual amount must have been more than $100,000. Meanwhile, MATA is currently looking at a $60 million deficit for its next fiscal year. Continue reading

California HSR Costs May Exceed $200 Billion

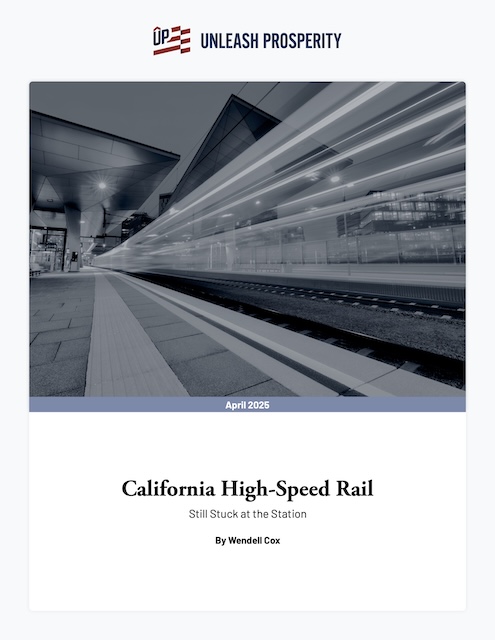
If someone doesn’t put a stop to pouring money down the high-speed rail drain soon, the California project could end up costing well over $200 billion, according to a new report by Wendell Cox. Cox made this estimate, which is about twice the current official estimate, by applying the average of the cost overruns of the portions built so far to the current cost projections of the remaining parts of the project.

Even if the costs don’t reach quite that high, Cox says, it is likely that a full high-speed rail line between San Francisco and Los Angeles will not be ready to ride before 2045. Cox bolsters these projections with statements from the state’s own peer reviewers who have been monitoring the project since 2009. Continue reading

Is Transit Safer Than Driving?

“Is public transit really safer than driving?” asks Unscientific American. I call it “unscientific” because the magazine’s methodology was to ask Todd Litman, a Victoria BC transit advocate who has done work for the American Public Transportation Association — not exactly an unbiased observer.

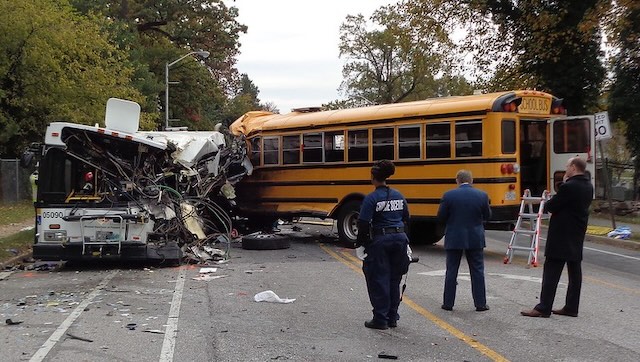
Six people died in this 2016 collision between a school bus and a transit bus in Baltimore. Photo by National Transportation Safety Board.

Litman compared auto fatality rates per billion passenger-miles on all urban roads in 2022 with those on all rail transit in 2013 and all transit buses in 2021. The first problem with this approach is the differences in years: transit carried 40 percent fewer passenger-miles yet killed about 40 percent more people in 2022 than in 2013, so the fatality rate for rail transit was much higher in 2022. Continue reading

February Driving 4.6% Greater Than in 2019

Americans drove 4.6 percent more miles in February 2025 than in the same month of 2019, according to data released yesterday by the Federal Highway Administration. Both urban and rural driving surpassed 2019 levels, as well as driving on all major types of roads: interstates, other arterials, and other roads. This is the first time since the pandemic that driving on all types of roads exceeded 2019 levels.

The February release presented some surprises. While February driving in Massachusetts was still less than 90 percent of pre-pandemic miles, Californians drove 5.5 percent more, Hawaiians 8.0 percent more, and Oregonians 7.0 percent more miles than in 2019. The only western states where driving fell short of 2019 miles were New Mexico, Washington, and Wyoming. Continue reading